Introduction
Direct absorbance-based protein concentrations are usually determined using the absorbance value measured at 280 nm. This wavelength is appropriate to use when measuring purified proteins containing tryptophan, tyrosine or cysteine residues in the primary protein sequence.
Protein or peptide sequences that do not contain these amino acid residues may be quantified in non-absorbing buffer systems using absorbance values measured at lower wavelengths.
The DeNovix DS-11 Series Peptide app enables protein or peptide concentration determinations based upon absorbance values at either 215 nm or 205 nm.
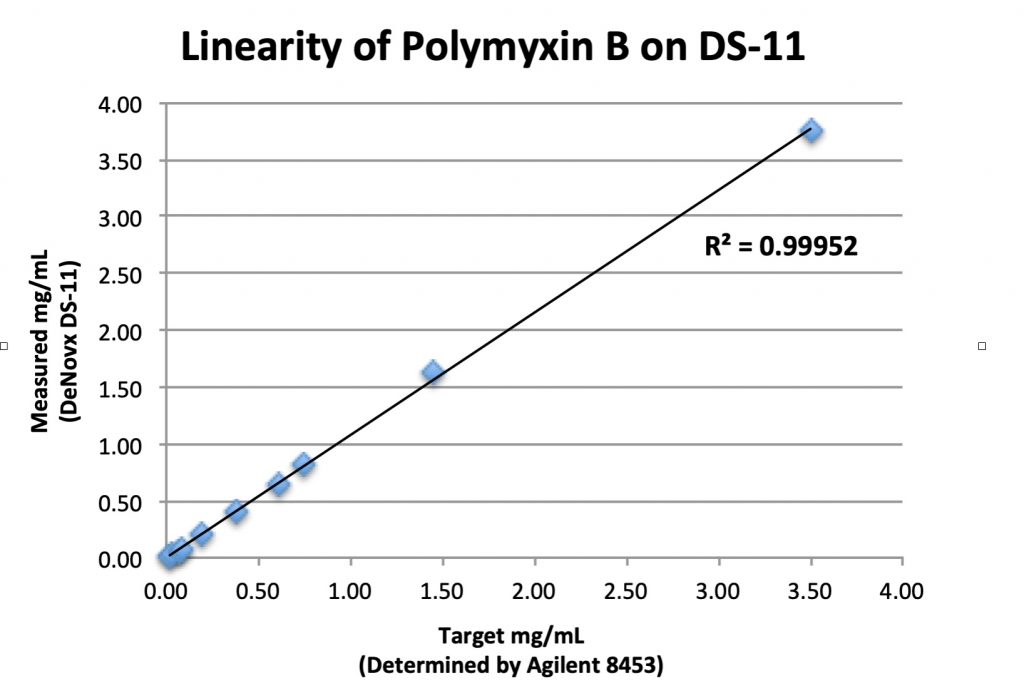
The purpose of this technical document is to present microvolume mode performance data demonstrating that the DS-11 can be used to determine the concentration of a peptide across a wide linear range.
Materials and Methods
A 1.5 mg/mL solution of Polymyxin B sulfate salt (Sigma Aldrich, cat #P4932) was volumetrically prepared in dH20. A series of ten dilutions ranging from 0.02 to 3.5 mg/mL was then prepared for the Polymyxin B. Reference concentrations for the dilutions were determined using an Agilent 8453 (Agilent, Santa Clara CA) in a 1 mm quartz cuvette (Starna, cat #1-Q-1). The values for solutions above the linear range of the Agilent were determined by gravimetrically diluting the samples to fall within the Agilent’s range.
The DS-11 Peptide app microvolume mode was then used to measure five 1 μL aliquots for each solution. Fresh aliquots were used for each measurement. Concentrations were calculated by applying Beer’s Law, using a 10 mm equivalent of the 215 nm absorbance values and an E0.1% value of 11.7.
Results
The results presented below demonstrate that the DS-11 microvolume mode can be used to determine the concentration of a typical peptide at low UV wavelengths (Table 1). The measurable concentration ranges for different proteins are presented as a function of the extinction coefficient at the absorbance analysis wavelength (Figure 1).
| Expected mg/mL | Measured mg/mL (avg. n=5) | Standard Deviation mg/mL |
|---|---|---|
| 0.019 | 0.02 | 0 |
| 0.034 | 0.036 | 0.005 |
| 0.065 | 0.062 | 0.004 |
| 0.081 | 0.08 | 0.007 |
| 0.196 | 0.2 | 0.007 |
| 0.386 | 0.404 | 0.005 |
| 0.609 | 0.644 | 0.005 |
| 0.743 | 0.818 | 0.004 |
| 1.444 | 1.62 | 0.01 |
| 3.5 | 3.742 | 0.057 |
09-JUN-2022


