Introduction
Fluorescein and its derivative fluorescein isothiocyanate (FITC) are ubiquitous in cell and molecular biology as a fluorescent label for cells and in many other applications. Fluorescein is a fluorescent compound that is easily detected using a fluorometer or fluorescence microscope. Fluorescein has an excitation maximum at 490 nm and an emission maximum at 514 nm.
DeNovix QFX Fluorometer and DS-11 Series Spectrophotometer / Fluorometers enable precise fluorescein quantification using a proprietary optical fluorescence core and four user-selectable LED channels. The data presented in this note was measured in the Basic Fluorometer app of EasyApps™ software.
Materials and Methods
A fluorescein dilution series diluted from a fluorescein standard (ThermoFisher Scientific cat #F36915) was quantified on a DeNovix QFX fluorometer.
The 50 µM standard was diluted in 0.05 M borate buffer with pH 8.5. A dilution series with 12 fluorescein concentrations between 0 nM and 2500 nM was created by serial dilution. Sample volumes of 200 µL were measured in 0.5 mL PCR tubes (DeNovix cat #TUBE-PCR-0.5-500). Measurements were made in the Basic Fluorometer app using the blue channel. The blue channel excitation range is 442 – 497 nm, and the emission range is 514 – 561 nm.
Results
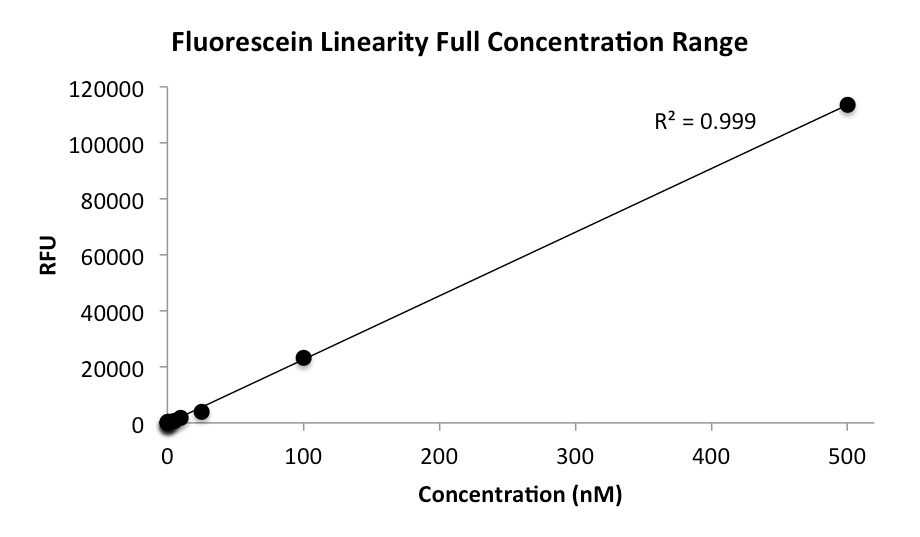
The fluorescein standard curve from 0 to 500 nM is shown in Figure 1. Linearity was exhibited between 0.05 and 2500 nM fluorescein. Table 1 shows the raw data for the full dilution series.
| Fluorescein Concentration (nM) | RFU (n = 3) | StDev | %CV |
|---|---|---|---|
| 0 | 116.67 | 0.80 | 0.7 |
| 0.05 | 123.29 | 0.99 | 0.8 |
| 0.1 | 131.21 | 0.38 | 0.3 |
| 0.25 | 155.95 | 0.62 | 0.4 |
| 0.5 | 196.84 | 0.33 | 0.2 |
| 1.0 | 274.67 | 1.23 | 0.4 |
| 5 | 901.25 | 1.90 | 0.2 |
| 10 | 1699.35 | 3.65 | 0.2 |
| 25 | 4087.39 | 15.74 | 0.4 |
| 100 | 23394.95 | 33.14 | 0.1 |
| 500 | 113476.45 | 190.03 | 0.2 |
| 1000 | 221854.98 | 507.98 | 0.2 |
| 2500 | 534489.98 | 1459.92 | 0.3 |
29-APR-2022


