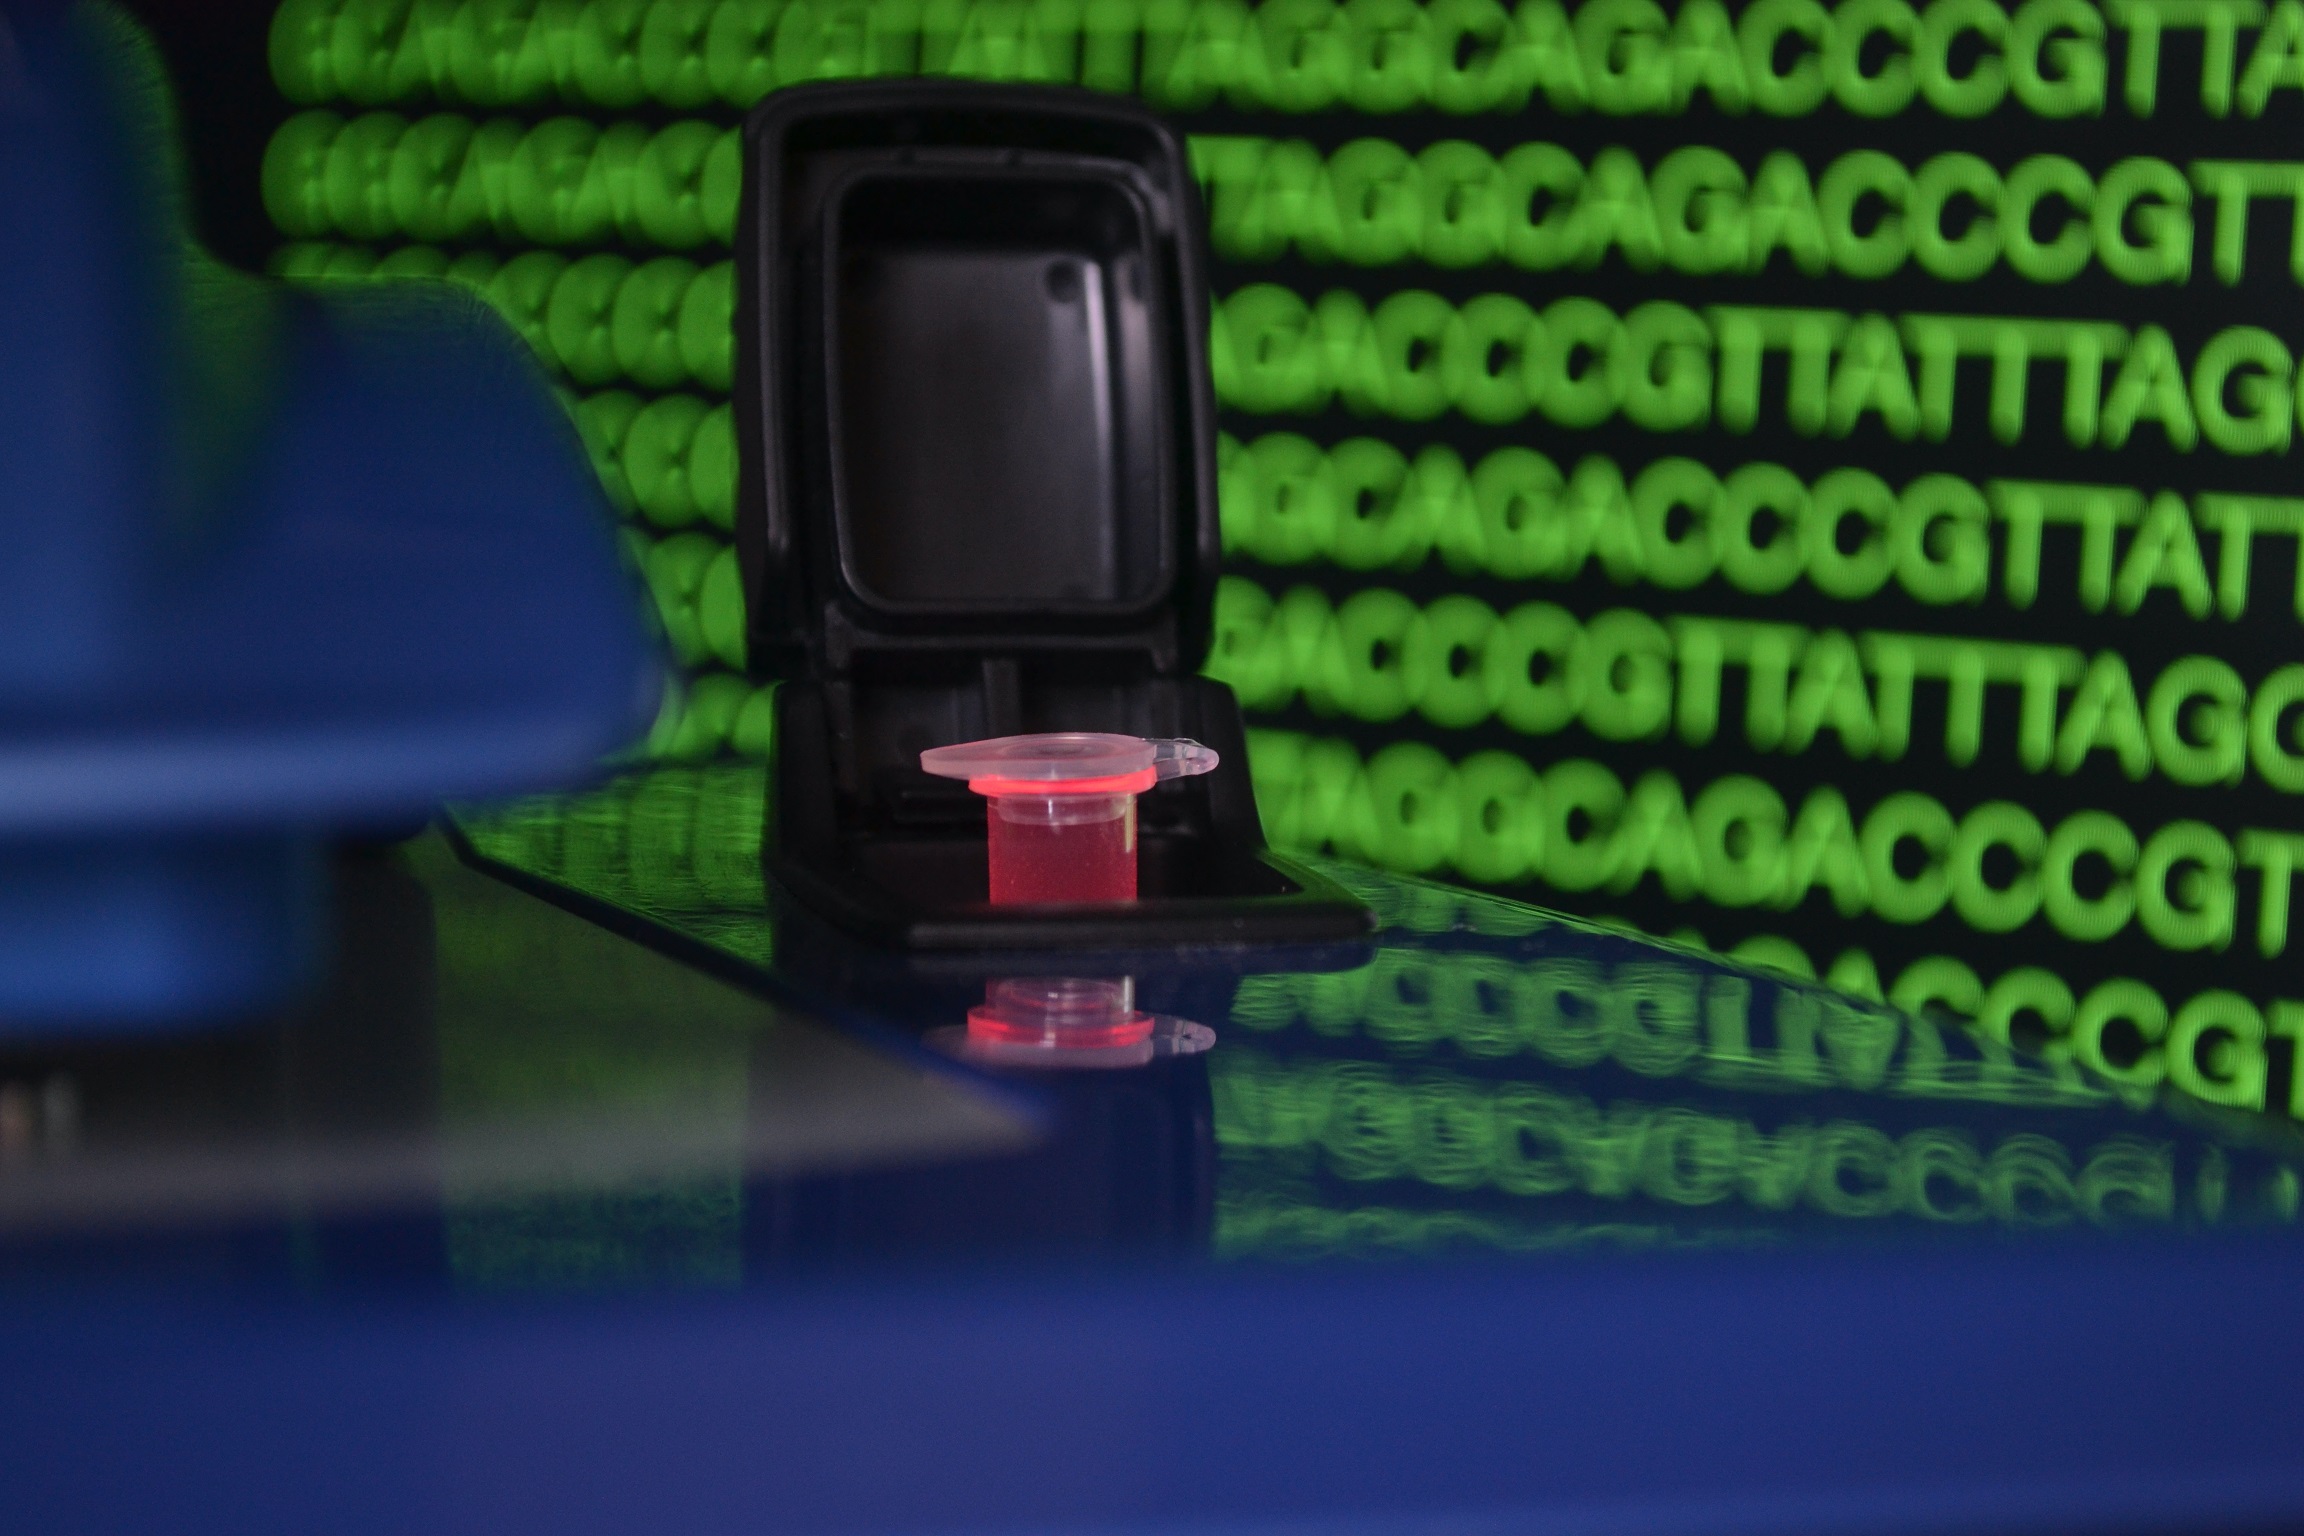
The DeNovix DS-11 Series Spectrophotometer / Fluorometer allows the user to perform accurate absorbance and fluorescence quantification across a wide dynamic range.
The dual mode spectrophotometer is equipped with SmartPath® Technology, which enables precise and reproducible measurements for both 1 µL and cuvette absorbance modes. The fluorescence component has a proprietary optical core which uses LED excitation sources and highly sensitive photodiodes which can detect minute amounts of fluorescence across four wavelength ranges.
In the document linked below, we outline and compare the two complementary methods of absorbance and fluorescence quantification.
Basics of Absorbance Measurements
UV-Vis absorbance methods are a standard method to quantify purified biomolecules in life science laboratories. It is popular as it enables fast detection of molecules based on their absorbance profiles at specific wavelengths. These measurements also provide an indication of sample contamination.
The shape of the absorbance spectrum changes based on other molecules that are present, which also absorb at or near the same wavelengths as the molecule of interest.
Basics of Fluorescence Quantification
Molecules that absorb light at one wavelength (excitation wavelength) and emit light at another (emission wavelength) are called fluorophores.
The structure of some fluorophores can be manipulated to fluoresce only when they are bound to a specific molecule (e.g. double-stranded DNA). This binding specificity is used by fluorescence assays to determine a direct correlation between the amount of fluorescence emitted by a sample and the concentration amount of the biomolecule of interest within the solution.
Mixing a fluorophore with a sample of known concentration and measuring the Relative Fluorescent Units (RFU), you can determine a relationship between the two which can be plotted and used as a standard curve. The fluorophore emission when bound to unknown samples can then be plotted against this standard curve to determine sample concentration.
See the full comparison between absorbance and fluorescence quantification methods in this app note.