Introduction
The DeNovix DS-11 Series Microvolume Spectrophotometer’s SmartPath™ technology enables highly reproducible measurements of dyes often used to label probes for genomic and proteomic array studies. The Microarray and Labeled Protein apps allow the researcher to rapidly determine the post labeling efficiency of a reaction by determining both the concentration of a nucleic acid or protein and the conjugated dye in a single 1 μL sample.
The purpose of this document is to present typical DS-11 Series performance data, demonstrating its ability to determine the concentration of a dye across a broad linear range based upon the absorbance at its maximum excitation wavelength.
Materials and Methods
A 200 μM solution of Alexa Fluor® 555 carboxylic acid succinimidyl ester (Life Technologies, cat #A20009) was volumetrically prepared in 0.05 M borate buffer. The buffer was prepared using a BupH Dry-Blend Pack (Pierce, cat #28384) and HPLC grade water (Ricca cat #9153-1). A series of ten dilutions ranging from ~0.4 μM to 200 μM was then prepared for the Alexa Fluor 555.
Reference concentrations for the dilutions were determined using an Agilent 8453 (Agilent, Santa Clara CA) in a 1 mm quartz cuvette (Starna, cat #1-Q-1).
The microvolume mode was used within the Microarray app on the DS-11 instrument to measure ten 1 μL aliquots for each dye solution. Fresh aliquots were used for each measurement.
Concentrations were calculated by applying Beer’s Law, using 10 mm equivalents of the 555 nm absorbance values and an extinction coefficient of 1.5 x 10⁵.
Results
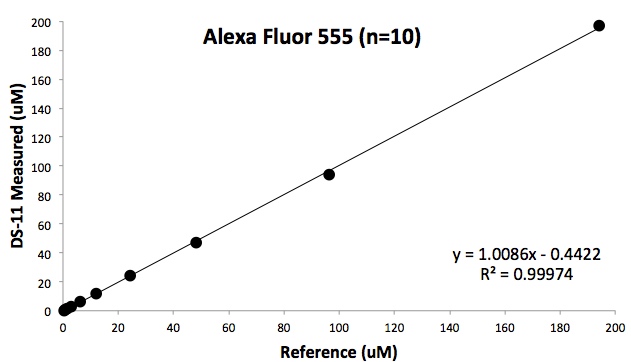
The results presented demonstrate that the DS-11 can be used to determine the concentration of a typical fluorescent dye used to label microarray and protein probes (figure 1 and table 1). The measurable concentration ranges for different dyes will be a function of the dye’s extinction coefficient at the absorbance analysis wavelength.
| Expected μM | Measured μM (avg. n=10) | Standard Deviation μM |
|---|---|---|
| 0 | -0.09 | 0.04 |
| 0.39 | 0.22 | 0.1 |
| 0.77 | 0.66 | 0.1 |
| 1.54 | 1.26 | 0.13 |
| 3.07 | 2.91 | 0.12 |
| 6.12 | 6.05 | 0.16 |
| 12.17 | 12.13 | 0.05 |
| 24.21 | 24.06 | 0.15 |
| 48.31 | 47.34 | 0.24 |
| 96.41 | 94.32 | 0.13 |
| 194.12 | 196.77 | 0.34 |
Alexa Fluor® is a registered trademark of Life Technologies Corp. and is used for identification and references purposes only. DeNovix, DeNovix products, and this website are not endorsed or authorized by, or in any way affiliated with Life Technologies Corp.
24-MAR-2025


