Can the CellDrop Automated Cell Counter Reliably Count Organoids?
As demonstrated by the data in this technical note, the CellDrop FLi Automated Cell Counter provides rapid, reliable counts of organoids with its machine learning-based Organoids App. In addition to standardizing organoid counts, the App also provides an assessment of sample quality by measuring the percentage of dissociated cells and objects.
Introduction
3D cell culture is an emerging technique that is far more representative of in vivo conditions compared to 2D cell culture. This method better replicates the natural biological environment, allowing for an improved understanding of cellular diversity, architecture, and cell-to-cell interactions. Due to its resemblance to in vivo conditions, this technique has been actively developed and optimized for disease research, precision medicine, and drug development. 3D cell culture has enabled advancements that were previously not possible with traditional 2D monolayer cell culture samples.
Using 3D cell culture, cells can form many different complex structures such as spheroids, tumorspheres, and organoids. Spheroids are simple multicellular structures, tumorspheres are spherical structures developed by the proliferation of cancer cells, and organoids are complex multicellular structures that resemble tissue-like structures with self-organizing capabilities1,2,3. Accurately measuring the concentration of tumorspheres or organoids in a sample is required for proper dose response, experimental consistency, reproducibility, and quality control for downstream applications.
DeNovix used advanced machine learning techniques to develop algorithms that reliably report the concentration of 3D cell culture structures like organoids, spheroids, and tumorspheres. The application also provides key quality and health information about the sample by reporting the percentage of dissociated cells and objects. These are defined as cells and objects in the culture that are not attached to organoids but are present in the same focal plane; their percentage is a key indicator of 3D cell culture health. In contrast, multicellular objects in the field of view with defined borders and diameters ranging from 20 – 350 µm are identified as organoids in this technical note.
Challenges of Counting 3D Cell Culture Structures Using Automated Cell Counters
In research settings, automated cell counters provide significant benefits over manual counting, such as enhanced speed, improved accuracy and reproducibility, and streamlined electronic data management. However, most automated cell counters are optimized for 2D cell suspensions. 3D cell culture structures are larger structures with irregular sizes and shapes (Figure 1) and often exist in complex culture environments. These complications make using traditional automated cell counters unreliable, while manual hand counting can be time-consuming and introduces human error and bias.
Figure 1. Brightfield image of CHO cell culture cells with uniform morphology (Left) compared to the heterogeneous composition of 3D cell culture structures (Right).
Moreover, most automated cell counters and hemocytometers are equipped with the standard 100 µm chamber height, which is not large enough to accommodate the varying sizes of structures present in 3D cultures. Such restrictions can lead to reproducibility and accuracy issues as larger structures are not accurately accounted for across the field of view.
Using DeNovix patented DirectPipette™ technology, two chamber heights, 200 µm and 400 µm, have been optimized for 3D cell counting to address this issue. The chamber height selection is based on reports that the optimal size range of healthy 3D cell cultures for assays and reliable results is between 150 µm and 350 µm4,5. The 200 µm chamber height is optimized for smaller structures under 200 µm while the 400 µm chamber height is recommended for larger structures and cultures with more clusters. Another advantage of these optimized chamber heights is that it eliminates the blockage of sample flow into the field of view caused by larger structures, which is common when using the 100 µm chamber height.
Machine Learning Methods for Optimizing Cell Counting
Using advanced machine learning methods, DeNovix scientists developed a unique application to identify and count organoids and related structures. The model was trained on a large variety of sample types and can accurately identify the range of shapes, sizes, and densities typically observed. No further training of the model is required from the user.
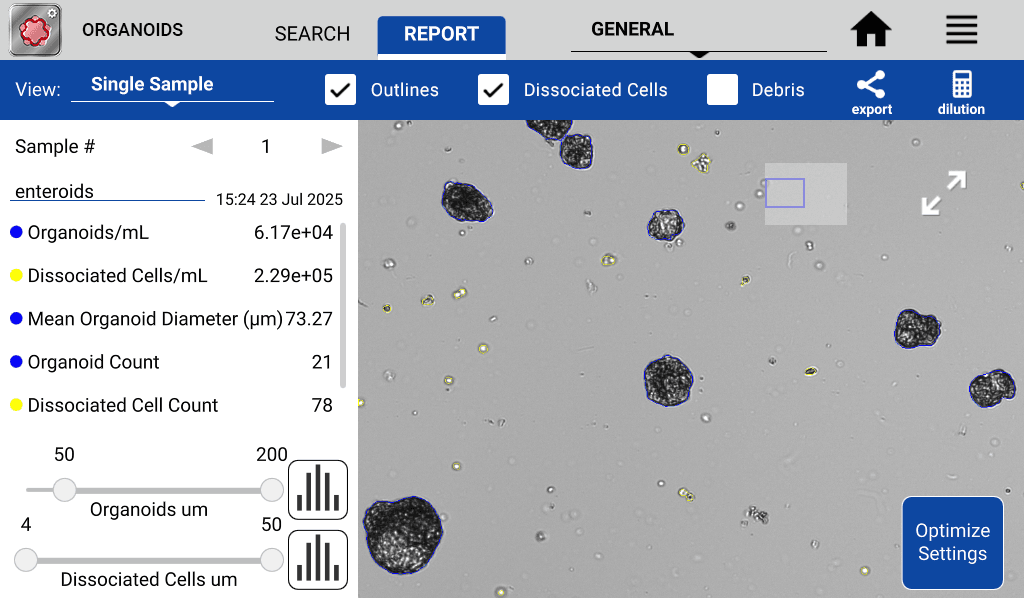
Additionally, the model was trained to identify dissociated objects to give qualitative as well as quantitative information about the health and stability of the cell culture (Figure 2). An abundance of dissociated cells in the sample may indicate compromised organoid integrity, as healthy cells are normally maintained within established 3D structures. The presence of free cells can suggest disruption or breakdown of organoid architecture. The time-intensive process of manually counting 3D structures and dissociated cells is eliminated by the Organoids App, which delivers rapid, quantitative, and qualitative assessment of samples in as little as 20 seconds.

Figure 2. CellDrop Organoids App: accurate identification and counting of organoids (blue outline) and dissociated cells (yellow outline).
Materials and Methods
To demonstrate the accuracy and reproducibility of the CellDrop FLi Organoids App, MCF7 cell lines were cultured into tumorspheres (organoid-like structures) using the PromoCell 3D Tumorsphere Medium XP reagents (PromoCell, Heidelberg, Germany), following the protocol described in the PromoCell Tumorsphere Cell Culture Protocol. Tumorspheres were harvested and counted on CellDrop FLi models using the protocols in the table below. Otherwise, specialized procedures with additional steps used in each individual experiment are described below. Wide bore tips were used for all workflows mentioned in this technical note.
| Count Parameters | Default | MCF7 Tumorsphere 200 µm Chamber Height | MCF7 Tumorsphere 400 µm Chamber Height |
|---|---|---|---|
| Dilution Factor | 1 | 1 | 1 |
| Min Organoid Diameter | 10 | 20 | 20 |
| Max Organoid Diameter | 200 | 200 | 400 |
| Min Dissociated Cell Diameter | 4 | 4 | 4 |
| Max Dissociated Cell Diameter | 50 | 20 | 20 |
For Serial Dilution Performance Data
To produce highly concentrated tumorsphere samples, tumorspheres were cultured in 6-well plates under optimal growth conditions for two weeks. The 6-well plates were pooled and transferred into 15 mL tubes using wide bore pipette tips. The tube was left upright for 30 minutes to allow structures to settle to the bottom. The supernatant media were removed until ~0.2 mL of the sample remained. The contents of multiple 15 mL tubes were pooled to get a dense tumorsphere starting concentration.
From this dense starting concentration of approximately 1 x 10e+05 organoids/mL, three serial dilutions were made by adding an equal volume of the preceding suspension to an equal volume of PBS for a total of four samples. The samples were then counted using the CellDrop Organoids App using the 200 μm and 400 μm chamber height. Each sample was counted with five replicates.
For % Dissociated Cells as a Marker of Tumorsphere Sample Health
Data was collected from an experiment focusing on both healthy and dissociated tumorspheres to demonstrate the qualitative and quantitative features of the Organoids App. Dissociated cells as a marker of compromised tumorsphere integrity were prepared from tumorsphere structures formed from MCF7 cells as detailed above.
The tumorspheres were divided into three groups: healthy, medium health, and low health. Disruption of the tumorsphere structures was carried out by mechanical force using a vortex. Samples labeled medium health were vortexed intermittently for a total of 5 minutes, and samples labeled low health were vortexed for a total of 10 minutes. Healthy (control) tumorsphere samples received no mechanical disruption. The samples were then counted using the Organoids App on the CellDrop FLi Automated Cell Counter at the 400 µm chamber height.
For Viability Measurement of Organoids
Tumorspheres were pooled in a centrifuge tube and incubated in 0.05% trypsin for up to 20 minutes at 37 degrees celsius to assess the viability of the PromoCell 3D Tumorspheres formed from MCF7s. The tumorsphere structures were then pulse vortexed 3 – 5 times and mixed with an equal volume of AO/PI (Acridine Orange and Propidium Iodide) before measurement in the AO/PI app.
Results and Discussion
Figure 3 shows the linearity and reproducibility of counting organoid structures on the CellDrop. The bar graphs represent the average organoids per mL of each group in the 200 µm chamber height (Figure 3A) vs. the 400 µm chamber height (Figure 3B). A paired T-Test showed that there was no statistically significant difference (p-value >0.05) between measurements performed on the 200 µm chamber height versus the 400 µm chamber height in each group.
Figure 3C represents the linearity of counting organoid structures on the CellDrop; for both chamber heights the R-squared values suggest that less than 5% of the observed values varied from the predicted value. Note that organoid measurements at each chamber height were taken on two separate CellDrop FLi instruments with different users, thus demonstrating linearity and reproducibility not only between chamber heights and devices but also between users.
Figure 3. Counts of serially diluted tumorspheres performed on CellDrop 1 and 2 at 200 and 400 µm chamber height respectively. (A) CellDrop 1 using the 200 µm chamber height. (B) CellDrop 2 using the 400 µm chamber height. (C) Expected versus actual organoid concentrations of the serial dilution on CellDrop 2. (D) Example image of tumorspheres at the 200 µm chamber height. The line graph shows the trendline and R-squared values. The error bars represent the standard deviation.
The quality of the samples in the healthy, medium health, and low health groups is represented by bars in Figure 4A. This graph shows the decreased quality of these structures, that is, an increase in the number of dissociated cells compared to intact tumorsphere structures due to mechanical stress via vortexing.
It is worth noting that individual cells within each organoid structure are not counted; rather, each organoid is counted as one object. The healthy samples have fewer than 50% dissociated cells while the mechanically disrupted samples show increasingly more dissociated cells, up to 90% in the low health sample.
Figure 4B shows that samples with fewer dissociated cells had a larger average organoid diameter. These results indicate that healthier MCF7 tumorsphere structures are larger in diameter than unhealthy or samples with higher percentage of dissociated cells. The integrity and size of the tumorspheres can also be visually assessed using the CellDrop touchscreen as shown in Figures 4 C, D and E.
Figure 4. Assessment of tumorsphere integrity after mechanical stress. (A) Percent dissociated. (B) Mean organoid diameter. (C) Healthy samples. (D) Image of medium health. (E) Image of low health samples. Images in C, D, and E were captured at the 400 µm chamber height. The bar graphs represent the average values. The error bars represent the standard deviation.
Determining the Viability of Organoids
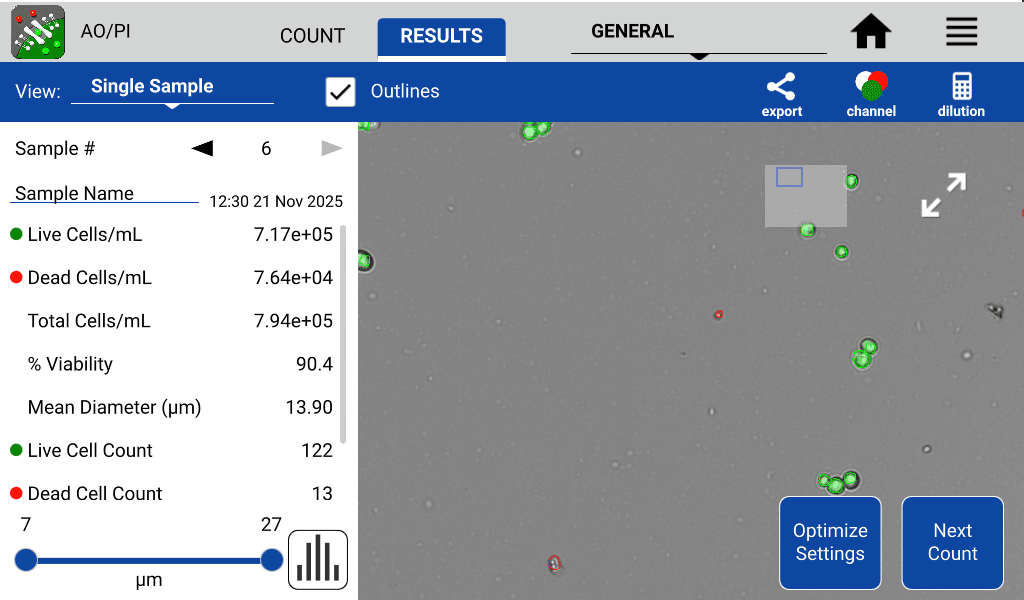
CellDrop is a versatile tool that can be used for assessment of organoid concentration, structural integrity, and viability. For viability assessment, tumorspheres were assessed using the dual fluorescence method of Acridine Orange and Propidium Iodide (AO/PI). Figure 5 shows over 90% cell viability and a medium cell diameter of about 14 µm.

Figure 5. Detached tumorsphere cells stained with Acridine Orange and Propidium Iodide for viability assessment. Cells fluorescing green are viable while red cells are non-viable.
Summary
This technical note demonstrates the accuracy, reproducibility, and practical advantages of the CellDrop Organoids App for 3D cell culture quantification and quality control.
- Accurate and Reproducible Counting: The CellDrop Organoids App provides accurate and precise measurements of organoids, spheroids, and tumorspheres across various densities and health status, with high linearity and reproducibility (as demonstrated with the serially diluted MCF7 tumorspheres).
- Advanced Machine Learning: The application uses advanced machine learning to reliably identify and count 3D structures (4 – 400 μm in diameter) and distinguish them from single, dissociated cells in complex culture environments.
- Qualitative Health Assessment: Beyond simple concentration, the App offers crucial quality and health information by reporting the percentage of dissociated cells and objects. A higher percentage of dissociated cells is shown to be a key indicator of compromised organoid integrity and sample health (e.g., after mechanical disruption).
The CellDrop Automated Cell Counter provides substantial practical benefits over manual methods, offering faster, more consistent, and standardized quantification, helping to streamline 3D cell culture workflows. CellDrop records, saves, and exports supplemental data that is not typically assessed during manual counting, such as the percentage of dissociated objects within the sample. In addition, the CellDrop paired with DeNovix AO/PI assay can be used to assess the viability of individual cells in a tumorsphere or organoid structure.
References
- Zhao, Z., Chen, X., Dowbaj, A.M. et al. Organoids. Nat Rev Methods Primers 2, 94 (2022). https://doi.org/10.1038/s43586-022-00174-y
- Johnson, S., Chen, H., & Lo, K. (2013). In vitro Tumorsphere Formation Assays. Bio-Protocol, 3(3), e325. https://doi.org/10.21769/bioprotoc.325
- Zanoni, M., Cortesi, M., Zamagni, A. et al. Modeling neoplastic disease with spheroids and organoids. J Hematol Oncol 13, 97 (2020). https://doi.org/10.1186/s13045-020-00931-0
- Singh, S. K., Abbas, S., Saxena, A. K., Tiwari, S., Sharma, L. K., & Tiwari, M. (2020). Critical Role of Three-Dimensional Tumorsphere Size on Experimental Outcome. BioTechniques, 69(5), 333–338. https://doi.org/10.2144/btn-2020-0081
- Debruyne, A., Okkelman, I., Heymans, N., Nobis, M., Borisov, S., Dmitriev, R. Live microscopy of multicellular spheroids with the multi-modal near-infrared nanoparticles reveals differences in oxygenation gradients. bioRxiv 2023.12.11.571110; doi: https://doi.org/10.1101/2023.12.11.571110
26-NOV-2025


