Introduction
DeNovix DS-11 Series and DS-8X Eight Channel Spectrophotometer instruments use proprietary SmartPath™ technology, in conjunction with an innovative microvolume design (Patent US 9442009), to enable measurements of samples with absorbance values as high as 750 AU (DS-11) / 220 AU (DS-8X) at a 1 cm equivalent pathlength.
This allows for accurate, reproducible quantification of bovine serum albumin (BSA) samples up to 1,125 mg/mL (DS-11) / 330 mg/mL (DS-8X) and dsDNA samples up to 37,500 ng/μL (DS-11) / 11,000 ng/µL (DS-8X).
This technical note will provide some background on the relationship between two terms—transmittance and absorbance—and explain the Beer-Lambert Law. This information will then be used to explain how the DS-11 and DS-8X enable the measurement of samples with ultra high concentrations.
Transmittance
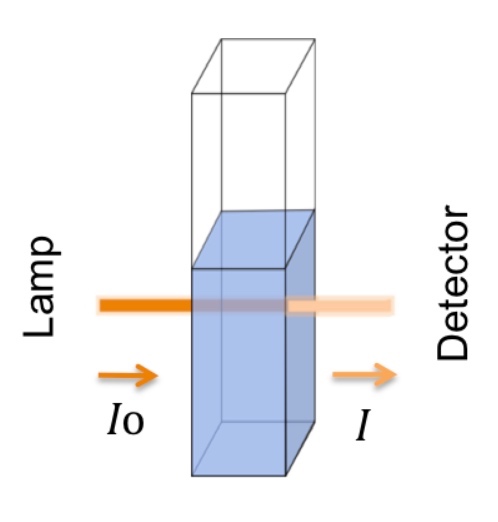
Transmittance (T) is defined as the fraction of incident light (radiant power) at a specified wavelength that passes through a sample as represented by Equation 1.
eq 1: T = ( I/I0 )
I is the light intensity after it passes through the sample, and I0 is the initial light intensity.
For example, completely transparent samples will have I = I0, and therefore the percent transmittance will be100%. Samples that permit no light at a specified wavelength to pass through will have a percent transmittance of 0%.
Absorbance
Absorbance (A) is defined as the the capacity of a sample to absorb light (radiation) and is expressed as the negative log ratio of transmittance (T), as shown in Equation 2.
eq 2: A = -log T or A = -log ( I/I0 )
Note: The I/I0 in Equation 1 refers to light passed though a single sample. The I/I0 in Equation 2 refers to light transmitted though a sample as a ratio of the the light transmitted through the blank solution.
In Equation 2, if A = 0, then no photons are absorbed and T = 100%. If A = 1.00, then 90% of the photons are absorbed and 10% reaching the detector (T = 10%).
A practical upper absorbance limit for most spectrometers is 1.5 A or 3% T. An absorbance value of 1.5 using the SmartPath 0.02 mm pathlength is equivalent to a 1 cm pathlength absorbance value of 750.
Beer-Lambert Law
The Beer–Lambert Law (or Beer’s Law) combines separate concepts that were first described by August Beer[1] and JoHann Lambert[2] (Equation 3). Beer’s Law stated that absorbance is proportional to the concentration of the sample. Lambert’s Law stated that absorbance is directly proportional to the thickness (or pathlength) of the sample. The combined law correlates the absorbance to both the concentration as well as the thickness (pathlength) of the sample [3] and is generally written as:
eq 3: A = εbc
A: absorbance
ε: absorptivity coefficient with units of L /mol*cm
b: pathlength of the sample expressed in terms of cm.
c: concentration of the sample in solution, expressed in mol/L.
Note: 1 cm = 10 mm. All references to pathlengths used on DeNovix spectrophotometers are expressed in terms of mm.
Absorbance vs. Pathlength
As mentioned above, there is a linear relationship between the the absorbance of a sample and the distance (pathlength) that the light travels through the sample. Using shorter pathlengths enables samples with higher absorbances (when expressed as 10 mm equivalent values) to be accurately measured.
The DS-11 and DS-8X use real-time absorbance data to determine the optimal pathlength for each sample. If a sample absorbance detected at the 0.5 mm microvolume pathlength is too high, the software will automatically move the arm down as needed to ensure that the measurement stays within the optimal detection range of the instrument.
Microvolume mode uses pathlengths ranging from 0.5 mm down to 0.02 mm (DS-11) / 0.03 mm (DS-8X). Even when the remarkably short pathlength is used, the typical CV associated with the very high concentrated samples is within 3%.
Short Pathlengths, High Concentrations
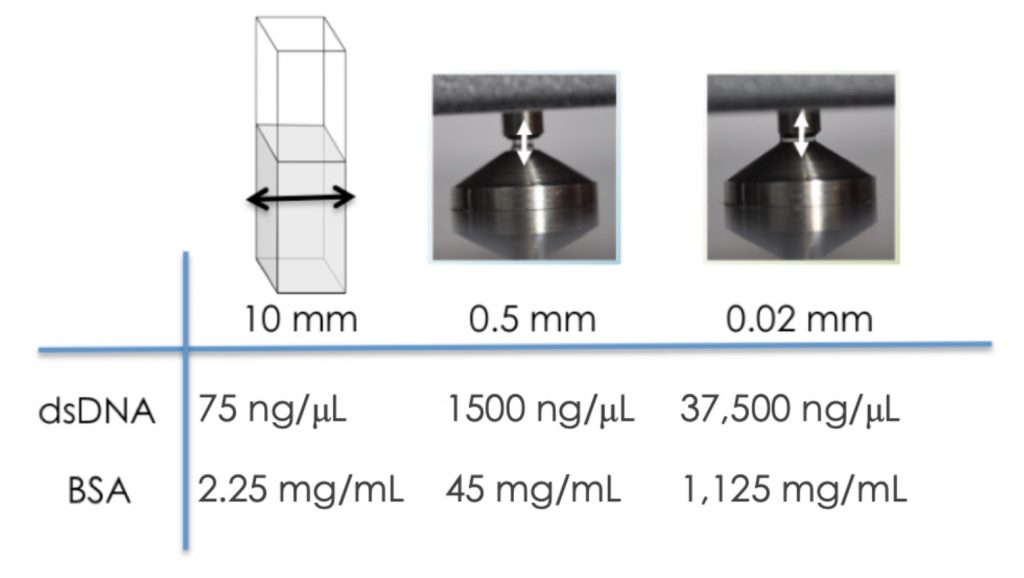
The DS-11 and DS-8X software uses the Beer-Lambert equation to calculate concentrations based on absorbance values at specific analysis wavelengths. Keeping in mind the relationships between absorbance, pathlength and concentration described by Beer’s Law, it is easy to understand that a decrease in pathlength (b) permits a corresponding increase in the measurable concentration (c).
Figure 2 highlights the maximum concentration for two commonly measured biomolecules using microvolume mode as compared to a traditional 10 mm cuvette based system.
Summary
SmartPath technology enables DeNovix spectrophotometers to measure samples more concentrated than any other spectrophotometers on the market today, making them the ideal choice life science research and manufacturing laboratories.
References
1. Beer (1852) “Bestimmung der Absorption des rothen Lichts in farbigen Flüssigkeiten” (Determination of the absorption of red light in colored liquids), Annalen der Physik und Chemie, vol. 86, pp. 78–88.
2. J.H. Lambert, Photometria sive de mensura et gradibus luminis, colorum et umbrae [Photometry, or, On the measure and gradations of light, colors, and shade] (Augsburg (“Augusta Vindelicorum”), Germany: Eberhardt Klett, 1760). p. 391.
3. Tissue, B. 2013. Basics of Analytical Chemistry and Chemical Equilibria John Wiley & Sons. Retrieved from http://books.google.com.
30-SEP-2024


