Introduction
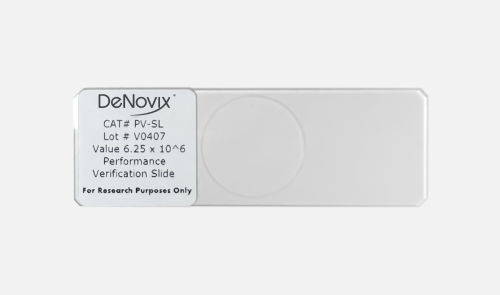
The performance verification slide is a slide with beads fixed on the surface and is designed for assessing the accuracy and precision of a CellDrop Automated Cell Counter. Each slide includes a factory-certified value for the number of beads on the slide (Figure 1). The beads are visible in brightfield, green, and red channels on the CellDrop, and therefore are suitable to validate all counting modes. The slide along with the instructions below offers a convenient method of validation. Interactive tables to record results is provided in Tables 1-3 at the end of this document.
Instrument Setup
- Clean the CellDrop sample chamber surfaces:
- Pipette 15 uL of 70% ethanol into the chamber with the arm down.
- Wait 10 seconds, then lift the arm and wipe the upper and lower chamber surfaces firmly with a dry lint free lab wipe.
- Refer to Tech Note 190 CellDrop Cleaning for further reference.
- Remove the DeNovix Performance Verification Slide from its case. Inspect the slide for dirt, debris, or smudges. Wipe with a clean and dry lens wipe if necessary.
- Note the certified density value marked on the slide. This will be the reference value against which the CellDrop counts will be compared.
- Create count protocols in 3 count apps for performance verification:
- Create a new protocol in the Brightfield app for brightfield channel verification
- Name the protocol Brightfield Channel Verification
- Input the following Count Settings
- Cell Outline Option: Enhanced Outline
- Sample Mode: Slide
- Small Cell Mode: Off
- Dilution Factor: 1
- Diameter (minimum): 6
- Diameter (maximum): 25
- Roundness: 30
- Press save
- Create a new protocol in the AO app for green channel verification
- Name the protocol Green Channel Verification
- Input the following Count Settings
- Cell Outline Option: Enhanced Outline
- Sample Mode: Slide
- Irregular Cell Mode: Off
- Dilution Factor: 1
- Diameter (minimum): 6
- Diameter (maximum): 25
- Roundness: 1
- Green Fluorescence Threshold: 1
- Press save
- Create a new protocol in the AO/PI app for red channel verification
- Name the protocol Red Channel Verification
- Input the following Count Settings
- Cell Outline Option: Enhanced Outline
- Sample Mode: Slide
- Irregular Cell Mode: Off
- Dilution Factor: 1
- Diameter (minimum): 6
- Diameter (maximum): 25
- Live Roundness: 20
- Dead Roundness: 1
- Green Fluorescence Threshold: 99
- Red Fluorescence Threshold: 1
- Press save
- Create a new protocol in the Brightfield app for brightfield channel verification
Measurement Protocol
- Brightfield Channel Verification
- Open the Brightfield app.
- Select the Brightfield Channel Verification protocol from the protocol selector
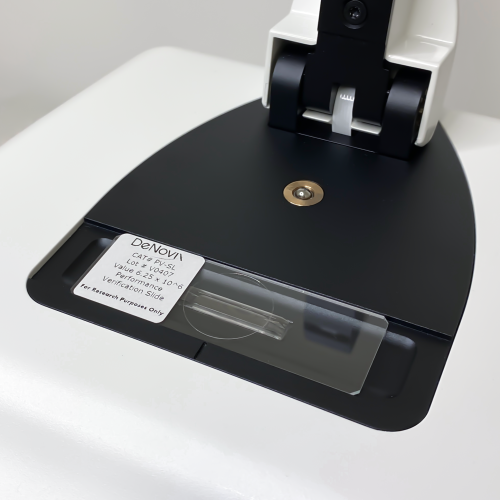
- Raise the arm and place the Performance Verification Slide on the CellDrop with the cover slip up. Center the slide over the lower sample surface as shown in Figure 2, and carefully lower the arm.
-
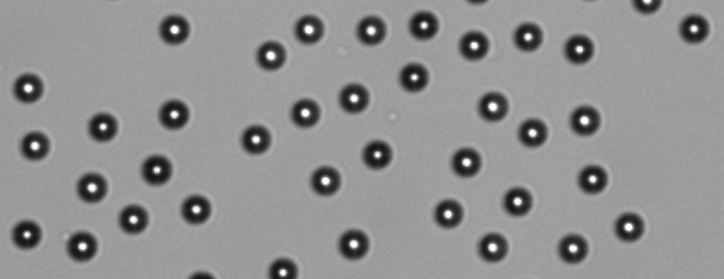
- Begin adjusting the focus by zooming in on the beads using pinch/zoom. Open the Focus menu and use the coarse and fine focus arrows to focus. The beads are focused correctly when bright white centers are seen as in Figure 3 below. Press OK to save the focus position. Please note that autofocus should not be used during this process.
-
- Press the Count button.
- From the Result screen, record the Cells/mL result for the replicate. Lift the arm to save the result.
- Tap the Count tab to return to the live preview. Lower the arm and repeat steps 1e and 1f until 5 replicates have been recorded.
- Green Channel Verification
- Open the AO app.
- Select the Green Channel Verification protocol from the protocol selector.
- Lower the arm to start the live preview.
- Touch the channel selector and choose the green channel live preview.
- Tap the exposure icon and adjust the green channel exposure to 15. Press OK to save.
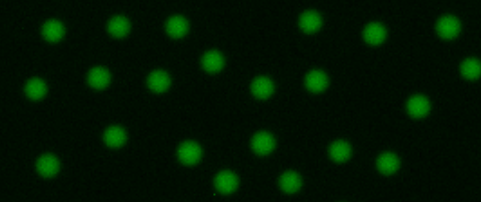
- Begin adjusting the focus by zooming in on the beads using pinch/zoom. Focus so that the beads appear sharp against the background as in Figure 4 below. Press OK to save the focus position. Please note that autofocus should not be used during this process.
-
- Press the Count button.
- From the Result screen, record the Live Cells/mL result for the replicate. Lift the arm to save the result.
- Tap the Count tab to return to the live preview. Lower the arm and repeat steps 2g and 2h until 5 replicates have been recorded.
- Red Channel Verification
- Open the AO/PI app.
- Select the Red Channel Verification protocol from the protocol selector.
- Lower the arm to start the live preview.
- Touch the channel selector and choose the green channel live preview.
- Tap the exposure icon and adjust the green channel exposure to 0.
- Touch the channel selector and choose the red channel live preview.
- Tap the exposure icon and adjust the red channel exposure to 20. Press OK to save.
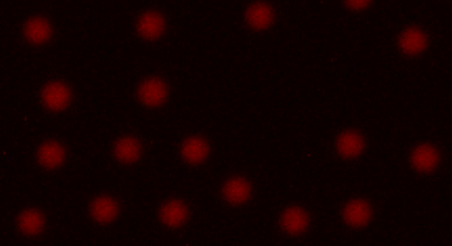
- Begin adjusting the focus by zooming in on the beads using pinch/zoom. Focus so that the beads appear sharp against the background as in Figure 5 below. Press OK to save the focus position. Please note that autofocus should not be used during this process.
-
- Press the Count button.
- From the Result screen, record the Live Cells/mL result for the replicate. Lift the arm to save the result.
- Tap the Count tab to return to the live preview. Lower the arm and repeat steps 3i and 3j until 5 replicates have been recorded.
Calculations and Evaluation
Note: A Calculator App is included at the bottom of this page for your convenience.
- Calculate the average for the results collected in the Measurement Protocols above.
- Calculate the absolute error of each replicate using the formula below:
-
- Absolute Error = Absolute Value of (Average – Replicate Result)
- Calculate the percent error of each replicate using the formula below
- Replicate Percent Error = (Absolute Error / Average) * 100
-
- Evaluate each result as pass or fail. If the percent error is less than or equal to 5.0%, then the result is PASS. If the percent error is greater than 5.0%, then the result is FAIL.
- Calculate the percent error for each average versus the Certified Value on the Performance Verification Slide.
-
- Average Percent Error = (Average – Certified Density)/Certified Density * 100
-
- Evaluate each average result for passing or failing. If the percent error is less than or equal to 10.0%, the result is PASS. If the percent error is greater than 10.0%, the result is FAIL.
The above method is intended to assess the accuracy and precision of the CellDrop Cell Counter. In case of any questions please contact DeNovix technical support for assistance.
Results and Calculation Tables
31-MAY-2023

