Introduction
It is common practice for molecular biologists to use the ratio of the measured spectrophotometric absorbance of a sample at 260 nm compared to the value measured at 280 nm as an assessment of purity for nucleic acid and, to a lesser extent, protein samples. Many researchers also look at the ratios of the 230 nm and 260 nm absorbance values as an important secondary measure of purity before using samples in time-consuming or expensive downstream applications.
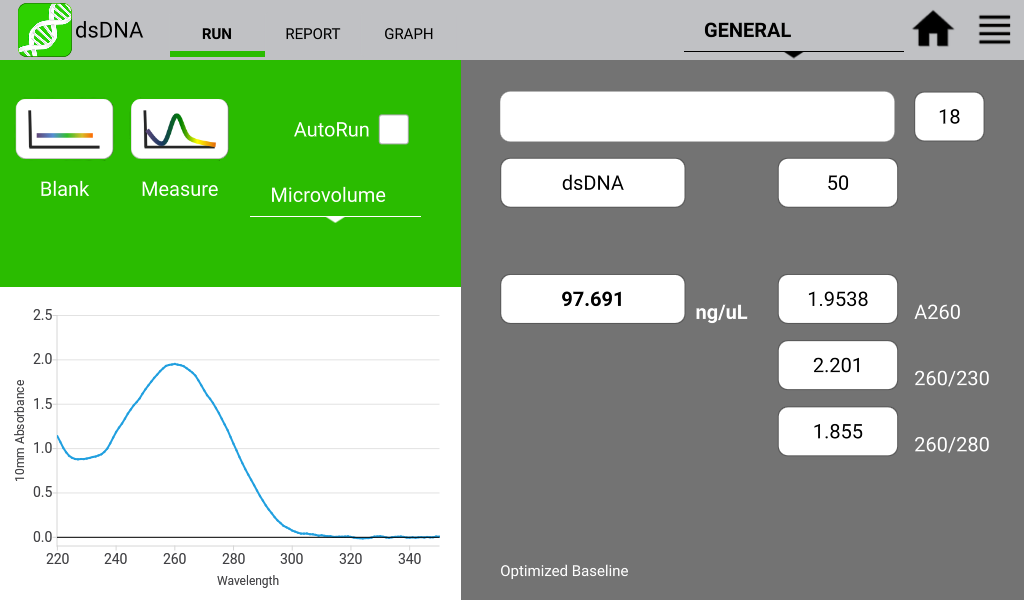
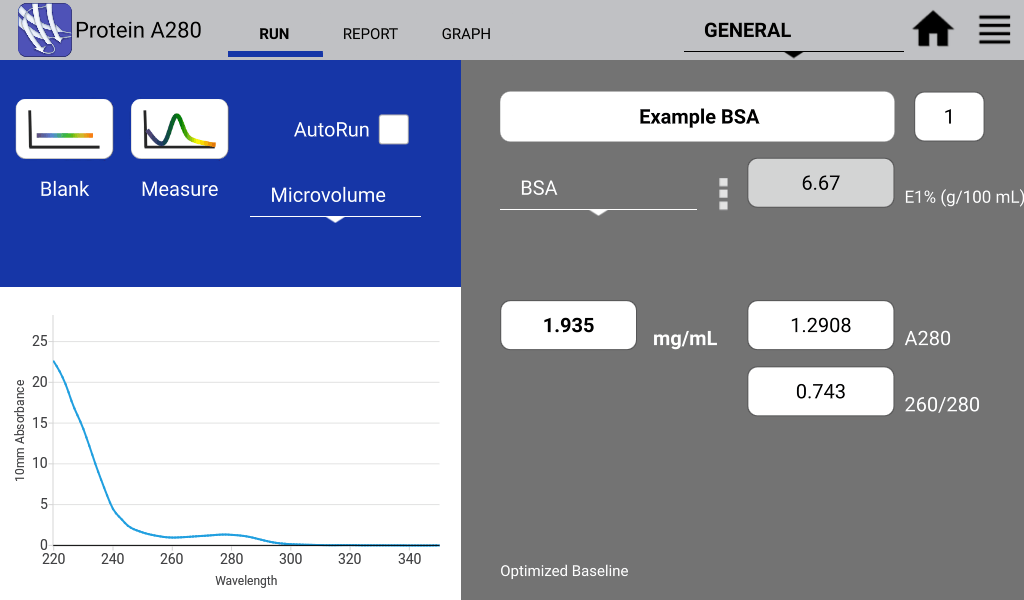
An example of a nucleic acid sample and a protein sample as measured on a DeNovix DS-11 Spectrophotometer are shown in Figures 1 and 2 below:
260/280 Nucleic Acid Purity Ratios
260/280 ratios are routinely used to determine the purity of nucleic acid measurements. This ratio is most commonly used to determine the presence of protein and or phenol in the isolated nucleic acid sample. Table 1 describes a general acceptable range for these ratios; however, they are not a guarantee of sample purity.
Table 1: Acceptable Range for 260/280 Ratios| Sample Type | Ideal | High | Low |
|---|---|---|---|
| DNA | ~1.8 | >2.0 | <1.7 |
| RNA | ~2.0 | >2.2 | <1.9 |
| Possible contamination | Basic | Acidic Phenol or Protein |
260/230 Nucleic Acid Purity Ratios
The 260/230 ratio is used to indicate the presence of unwanted organic compounds such as Trizol, phenol, Guanidine HCL and guanidine thiocyanate.
Generally acceptable 260/230 ratios are in the range of 2.0 – 2.2. Values higher than this may indicate contamination with the aforementioned compounds.
Common Nucleic Acid Contaminants
Despite the best efforts of the researcher, residual contaminants often remain in solution with nucleic acids following chemical isolation. The presence of these can lead to an incorrectly high concentration reading or the disruption of downstream processes.
Protein 260/280 Purity Ratio
DNA is a common contaminant of proteins isolated from whole cell lysates. When measuring purified proteins, the 260/280 ratio can be a useful tool to determine the purity of an isolated protein. An ideal 260/280 ratio for common proteins is 0.6. Higher ratios may indicate the contamination of isolated proteins with DNA.
Alternatively, the buffer used to isolate the sample protein may include components that absorb strongly in the UV region. Buffers and buffer components that fit this description include RIPA buffers, Triton, DTT, urea and thiourea.
Note: Colorimetric spectrophotometric methods such as the BCA or Bradford assays are generally recommended when working with buffers with UV region absorbance.
Troubleshooting Purity Ratios
The three most common causes of abnormal 260/280 ratios are listed below:
Microvolume vs. Cuvette
It has been reported that small changes in the pH of a solution may result in variances in nucleic acid 260/280 ratios[1]. Acidic solutions may under-represent the 260/280 ratio value by 0.2 – 0.3, while a basic solution may over-represent the ratio value by 0.2 – 0.3. If comparing ratios for samples measured on the microvolume mode and then diluted to be measured with a cuvette, ensure that the undiluted and diluted sample are at the same ionic strength and pH.
Variance From Other Instrument Brands
It is not unusual to observe slight differences in purity ratios when measuring the same sample on different spectrophotometers. Up to about a 0.4 difference in the 260/280 ratio may be observed when measuring the same nucleic acid sample on two spectrophotometers that are working within a 1 nm wavelength accuracy specification.
The absorbance of nucleic acid at 260 nm is measured within a plateau region of the spectrum, while the 280 nm absorbance is generally measured on a steep sloped portion of the spectral curve. The measurement of one value on a plateau and another on a slope means that a slight shift in wavelength accuracy will have a large effect on 260/280 ratios.
The DS-11 Series is specified to a wavelength accuracy of 0.5 nm. Instruments with larger wavelength accuracy specifications are less able to accurately report 260/280 ratios.
Summary
The ratio limits presented in this note are generally accepted ideal values. It is important to empirically determine the ratio limits that predict sample functionality in your downstream applications.
The DS-11 Series EasyApps software provides automatic alerts for samples outside these standard values, or custom thresholds can be entered.
References
1. William W. Wilfinger, Karol Mackey, and Piotr Chomczynski, Effect of pH and Ionic Strength on the Spectrophotometric Assessment of Nucleic Acid Purity: BioTechniques 22:474-481 (March 1997).
Learn More about the DS-11 Series
If you’re interested in learning more about the DeNovix DS-11 Series, consider signing up for a 7-Day Free Trial, scheduling a call with our applications team, or requesting a quote. Click the buttons below to take the next step!
NanoDrop™ is a registered trademarks of Thermo Fisher Scientific and its subsidiaries and is used for identification and references purposes only. DeNovix, DeNovix products and this website are not endorsed or authorized by or in any way affiliated with Thermo Fisher Scientific.
26-JAN-2024


