Technical Note 193

CellDrop Data App and Exporting Results

Introduction

CellDrop™ Automated Cell Counters allow for fast and intuitive cell counting and perform the entire count process, from sample loading to data export, in seconds. All data is automatically saved to the instrument’s onboard memory at the time of measurement. The standard onboard storage is 120 GB with the ability to store thousands of results. Upgraded memory storage up to 1 TB is available.

Data export options are accessed using the Export icon in the blue action bar, or the Export Results option in the overflow menu of any Count App and the Data App.

Export Options

Data may be exported from the CellDrop by several methods:

  • USB flash drive (FAT32 formatted)
  • External hard drive (FAT or MS-DOS formatted)
  • Email
  • Networked printer
  • Networked folder

CellDrop Report Types

The following types of reports can be generated by CellDrop for export:

  • .csv report including numerical data for counts and the protocol used
  • .pdf report including numerical count data, protocol details, with optional images and histograms. Limit of 20 samples per report
  • .png image of screen captures taken using the command in the overflow menu
  • .png files or raw and counted images in .png

Data Review

The Data App enables users to review data and images from previous sessions. The user may filter by App, date, and/or protocol name; multiple filters can be applied to a single search. Data can then be selected and added to the Result tab for review and export.

Results are automatically filtered based upon the account selected using the tab on the top action bar. When the General Account or a user-defined account is selected, only results generated by that account will be displayed in the results list.

  • Results may be sorted by tapping any category the column header.
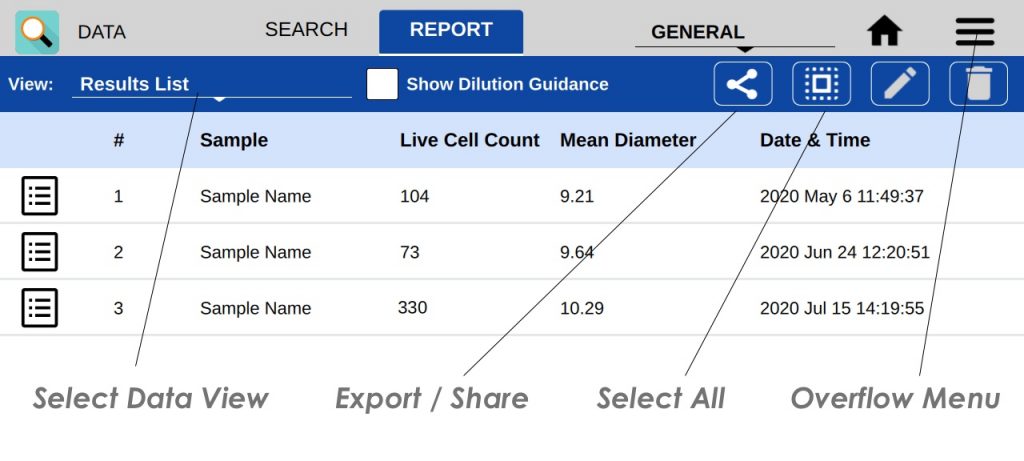
  • Tap Select/Deselect All icon to quickly highlight all samples.
  • Results from one app may be added to the Result tab.

Once the filter criteria have been selected, tap and highlight the samples of interest, then use the Add to Report + button to add selected samples to the Report tab. The Report tab enables users to view results in the following views:

  • Results List (default): lists results with a short summary of data
  • Single Sample: shows images, data, and enables optimization of count settings for each result. This view is the same as the result view when a count is completed in a Count App.
  • Images List: shows data summary and result image associated with each count result
  • Graphs: shows histograms for a single sample, and overlays histograms for multiple samples.

05-APR-2023